Our Services
At Better Tech Solutions, it’s important for us to take time to understand your priorities, vision, challenges, and objectives. From there, we can create a helpful solution that aligns with your goals. We offer packages customized to meet your needs that support both immediate goals and long-term growth.
We are a group of professionals committed to excellence, customer needs, attention to detail, and the ability to deliver refined solutions for our clients.
Business Optimization
We help organizations identify inefficiencies, bottlenecks, and missed opportunities that limit growth. By analyzing processes, data flows, and team workflows, we uncover practical improvements that increase efficiency, reduce costs, and improve performance.
Our approach focuses on measurable outcomes — aligning people, processes, and technology to create smarter operations and sustainable results.
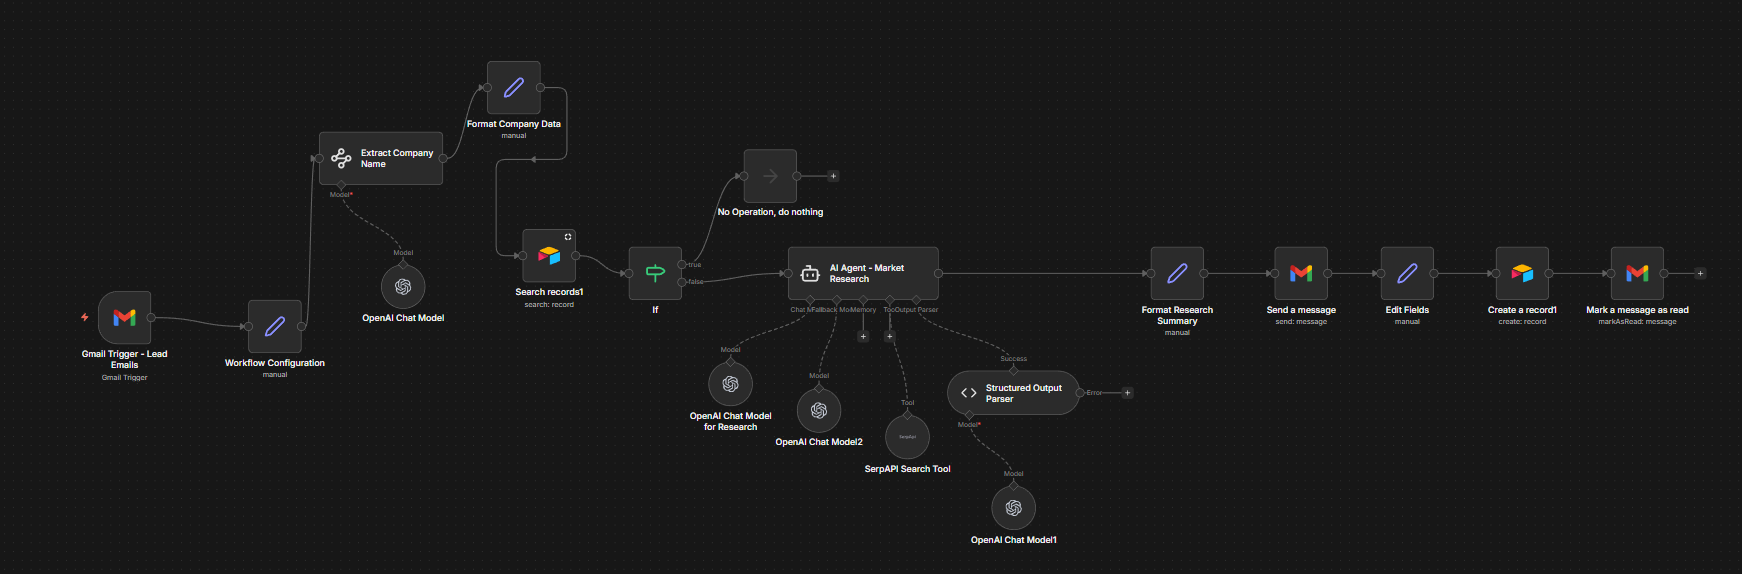
Workflow Automation
We help reduce the manual work that slows teams down. By working within your existing tools and using AI enabled resources, we simplify complex tasks and make critical information easier to access. Our work ranges from invoice tracking and accounts receivable reporting to integrated dashboards that highlight priorities, actions, and measurable outcomes.
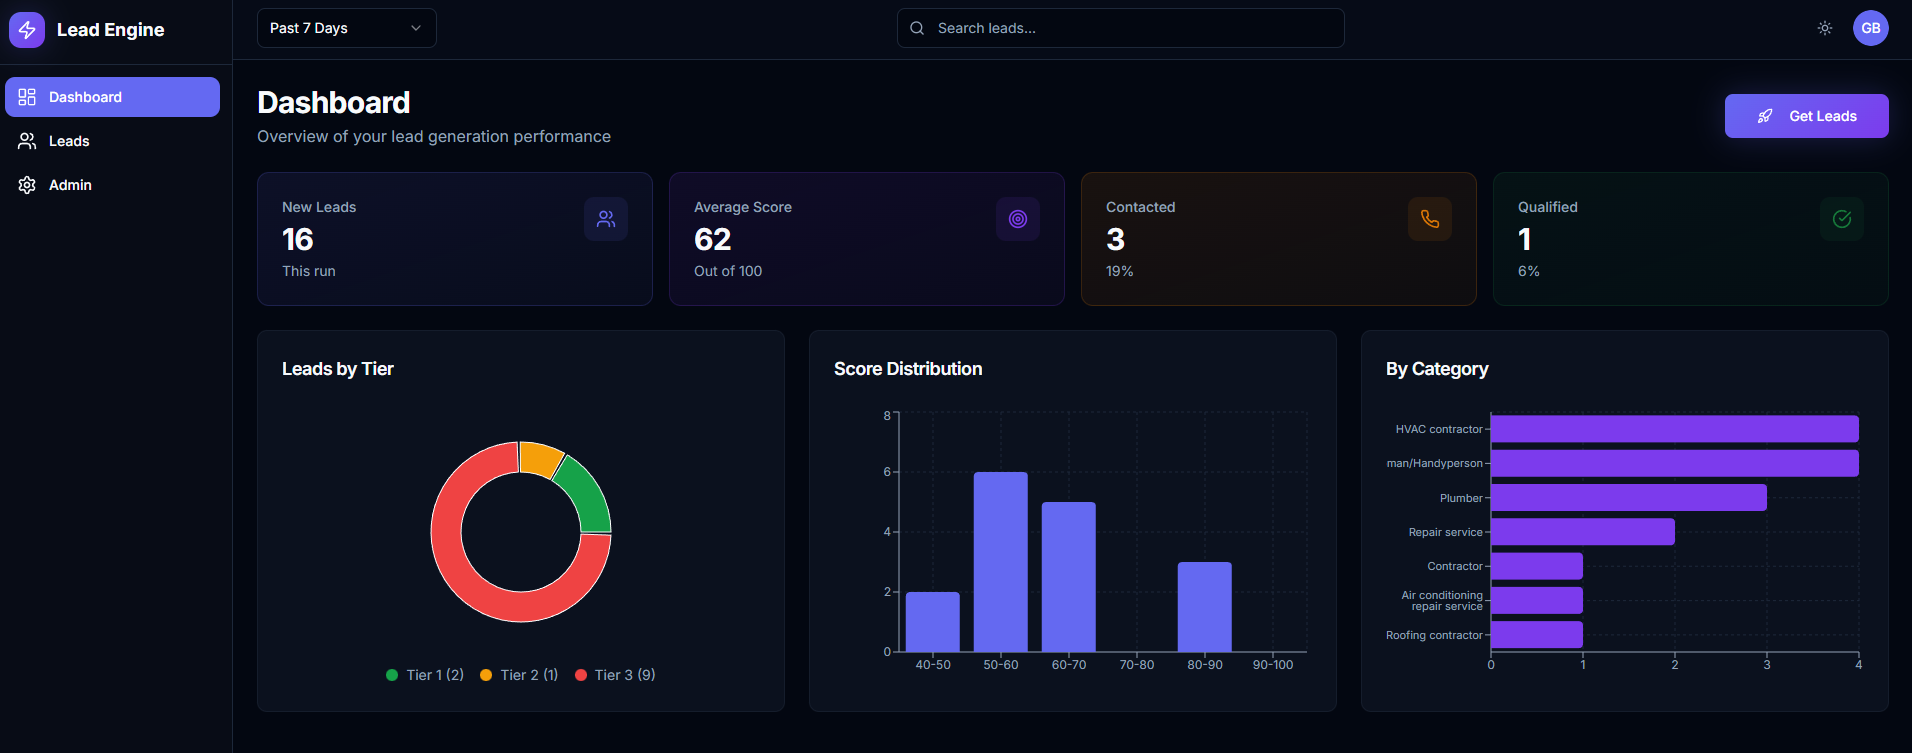
Dashboards and Applications
We design custom dashboards and applications that bring simple understanding to complex operations. By consolidating data, workflows, and key actions into a single, intuitive experience, we enable teams to understand what matters, what needs attention, and what is working.
Our solutions are built to be user-friendly. The result is technology that feels purposeful, reduces manual effort, and supports faster, more confident decision-making.